Against The Storm Explorer

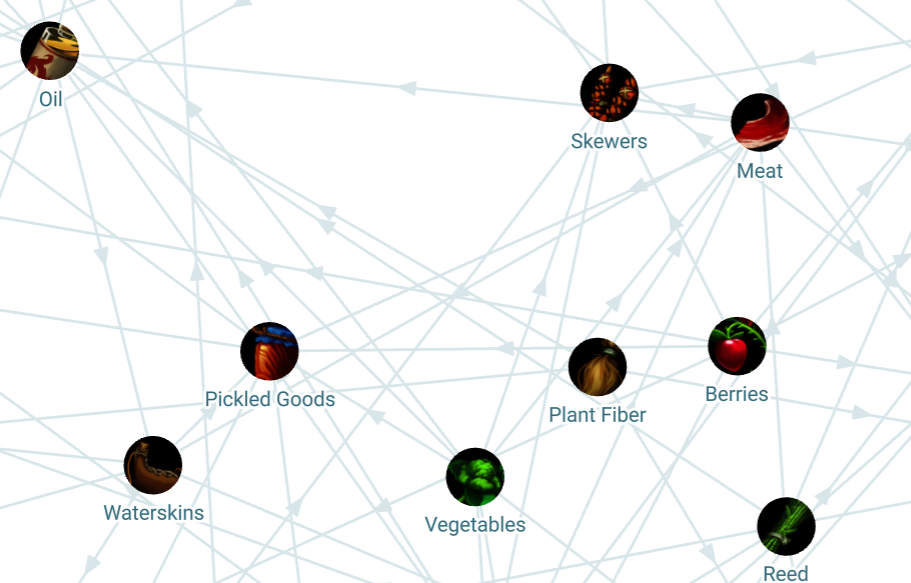
A Vite+React graph visualization for game data from Against The Storm, showing resources and the recipe connections.
If you're reading this in January of 2024, this project is still in progress, but considering it's deployed and usable, I thought it was worth documenting while I'm applying to other jobs.
Motivations and Overview
I love Against The Storm. Like, really love it - it's undoubtedly one of the most fun games I have ever played. It's also quite complex. There's a huge number of interwoven systems, and managing all your resources in game is quite a challenge. Consequently, I built a graph visualization of the different resources to help you plan your game. Using the graph, you could follow a production chain. For example, if you had clay and grain, you might trace through the graph from clay -> pottery -> ale -> packs of luxury goods, and draft buildings corresponding to this to get an economic engine online.
This project is actually two projects in one - the first to extract all the data from the game, then the second to convert all the JSON data into a graph.
Data Dumper (https://github.com/mwaterman29/AgainstTheStorm-DataGenerator)
Forked from an existing wiki generator, I adapted the existing code to dump all the recipes in the game. Instead of generating pages for each, I changed the representation to be a set of nodes (goods in game) and edges (recipes in game).
Though I could generate this by hand, the process for doing so would be unbelievably tedious. With over two hundred recipes in game, it'd take me hours and hours to get all the data. Especially seeing as there's an existing - and (fairly) easily modifiable - dumper, this was a no-brainer.
This follows the Reagraph format of nodes and edges, but has a lot of metadata as well. In addition to the mandatory id and such, information about the production of different goods, recipe ingredients, production time, and more is included.
Graph Visualization (https://github.com/mwaterman29/AgainstTheStormExplorer-site)
Once the data is dumped from game and all 7300 lines of json are written out, it's visualized using Reagraph. Reagraph is a wrapper around a Threejs canvas that provides an easy way to create nodes and edges. I ended up having to do a lot of manual customization to achieve the effects I wanted, but it's still relatively reasonable to do. It's particularly nice to automatically lay out the graph.